Introduction to GIS
When working with GIS (Geographic Information Systems), you need to build a map by adding different components. These components primarily consist of data layers, which provide the geographic and attribute information necessary to visualize and analyze spatial relationships. The most common type of data used in GIS is vector data, though raster data is also sometimes incorporated depending on the project requirements.
Understanding GIS Layers
In a GIS project, information is structured in layers, where each layer represents a specific type of geographic data. A complete GIS project typically consists of multiple layers that work together to create a meaningful and interactive map. Below are the primary layers used in GIS projects:
- Basemap Layer
A basemap is a foundational map that provides contextual geographic information. It helps in orienting users and visually enhancing the project by displaying background details such as terrain, political boundaries, and roads.
Examples of Basemap Sources:
- OpenStreetMap (OSM) – A widely used open-source basemap providing roads, buildings, and points of interest (incorporated into QGIS)
- Google Maps / Bing Maps – Commonly used for urban mapping and navigation
- Satellite Imagery (e.g., Esri World Imagery, NASA Blue Marble) – Useful for detailed land cover and environmental analysis.
- Shapefile Layer
Shapefiles are a common vector data format used to represent geographic features such as points, lines, and polygons. These files store both spatial and attribute data, allowing GIS users to analyze and manipulate different aspects of the mapped features.
Examples of Shapefiles in Use:
- Points: Locations of landmarks, fire hydrants, or businesses.
- Lines: Roads, rivers
- Polygons: Boundaries, buildings
Shapefiles typically come in a set of files with extensions such as .shp (geometry), .dbf (attribute table), and .shx (spatial index).
- Georectified Map Layer (Historic Maps)
A georectified map layer consists of historical maps or scanned paper maps that have been digitally aligned with real-world coordinates. This process, known as georeferencing, ensures that older maps can be overlaid with modern spatial data for comparative analysis. There are a number of online repositories for maps but the David Rumsey Map Collection is the most well-known.
Use Cases for Georectified Maps:
- Analyzing urban development over time (Mapping Inequality)
- Studying historical settlements and populations (DECIMA)
Tools for Georeferencing:
- QGIS Georeferencer Plugin
- ArcGIS Georeferencing Tool
- MapWarper (online tool)
*cheat code: OldMapsonline has lots of maps that have been already georectified that you can download.
- Data Layer (CSV and Other Georeferenced Data)
GIS projects often incorporate tabular data that contains spatial references. Comma-Separated Values (CSV) files are a common format for storing and importing georeferenced data. These datasets typically contain coordinates (latitude and longitude) that allow the information to be mapped accurately.
Common Uses for CSV Data in GIS:
- Displaying crime incidents (Mapping Violence)
- Mapping infanticide (BOM)
Example of a CSV File Format:
ID, Name, Latitude, Longitude, Category
1, Central Library, 40.7128, -74.0060, Education
2, City Park, 40.7150, -74.0020, Recreation
3, Museum of Art, 40.7794, -73.9632, Culture
GIS software can import these CSV files and convert them into point layers, allowing for further spatial analysis and visualization.
Let’s get started!
- Open QGIS
- Start a new project
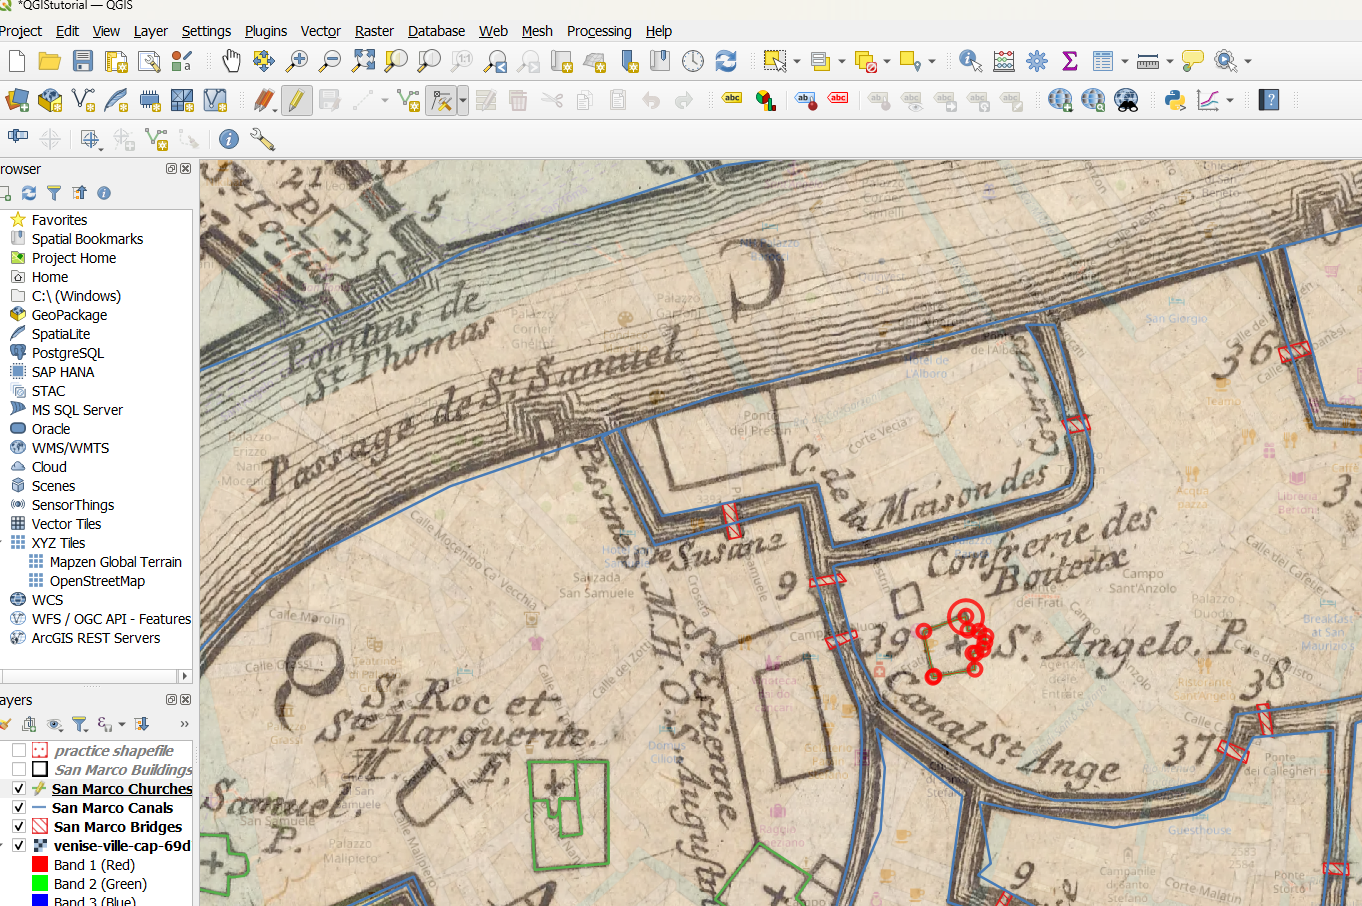
Note that you have to add components to create a map, which includes data. The data you will most often be working with is Vector (and sometimes Raster).Components of a Project are called Layers. In most GIS projects you will add a number of layers to the project. These layers will most often consist of the following:
- Basemap (these are maps already created which can be added inside the program). Example: Open Street Maps.
- Shapefiles (these are added to represent shapes on the map, like buildings, streets, and rivers)
- Georectified map layer of historic map (these are most often prepared beforehand and there are several programs which do it)
- Data (usually CSV files that have been georeferenced, or given coordinates)
Raster Data: Raster data is composed of a grid of pixels (cells), where each pixel has a specific value representing information such as color, elevation, or temperature.
Vector Data: Vector data represents objects using geometric shapes such as points, lines, and polygons, which are defined by coordinates.
Vector Data:
(Left top corner–click project)
- Set Baselayer
In the left menu, navigate to XYZ tiles. Click to expand and select Open Street Map. Click to add.
Your screen should look like this:
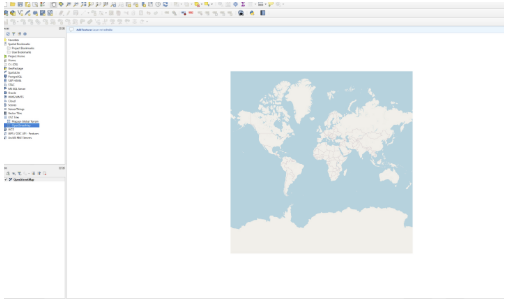
Zoom in with your mouse to Venice, Italy.
- Upload georeferenced map as a layer.
-
- Go to the google drive to download map here.
- Click layer > add layer > add raster layer
- Go to the google drive to download map here.
You can adjust the transparency layer as needed.
Now we’ll start creating shapefiles.
QGIS has a tutorial here which this has been adapted from.
Creating a Shapefile in QGIS
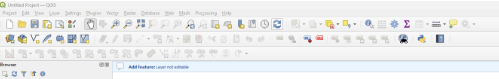
- Open QGIS and start a new project.
- Go to Layer > Create Layer > New Shapefile Layer.
- In the New Shapefile Layer dialog:
- Choose the file location and name your shapefile.
- Select the geometry type (Point, Line, or Polygon) depending on the feature you want to create.
- Set the Coordinate Reference System (CRS) to match your project.
- Define attributes: Add fields (e.g., Name, ID, Type) for the attribute table.
- Click OK to create the shapefile.
- Start Editing: Select the new layer, click the Toggle Editing button, and use the editing toolbar to draw your points, lines, or polygons.
- Save and Finish: Once all features are added, save your edits and click Toggle Editing again to finalize the layer. Drop it into a file and then upload to google drive.
Editing a Shapefile
- If you need to edit a shapefile that has already been created, first make sure you are working with the layer that contains the shapefile you wish to edit.
- Go to Toggle Edit and make sure it’s clicked on, then click the Vertex Tool:
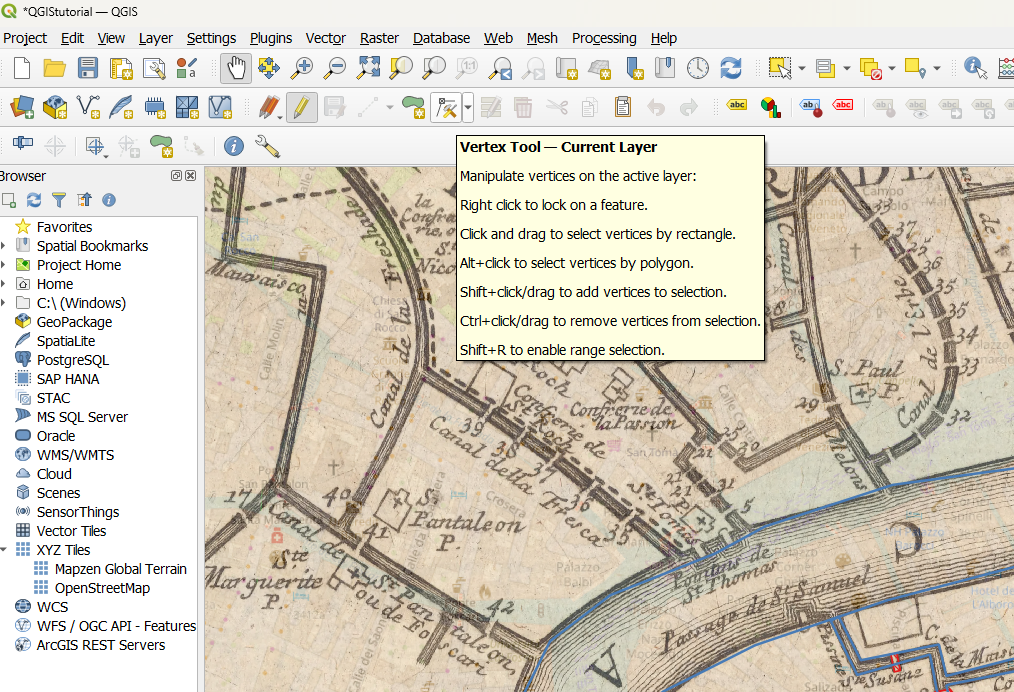
- Once the vertex tool is activated, hover your pointer over the vertices of the shapefile you want to change. The lines of the shapefile will be highlighted red and dots will appear on the corners of the shape. Single click the dot on the shape that you want to reposition, and click again to place in a different spot.
- Once you have adjusted the shapefile, make sure to click out of toggle editing and save your work.
Single Polygon Shapefile v. Multipolygon Shapefile
Like it was explained above, shapefile layers contain geometry like lines, points, or polygons depending on the feature you want to add to the layer in your QGIS project. Each layer stores the geometry you create, so depending on the purpose of your project you could save as many or as little shapes to a single shapefile layer as you need.
1) Single Line/Point/or Polygon Shapefile
Let’s think about the layers of your project in a different dimension. Imagine your layers vertically: your OpenStreetMap is the first sheet, it lays the foundation of your project and provides a template to build out your project.
Now that the foundation has been added to your project, you’ll add the georectified historic map on top of the first layer.*
*See the “Finding Historic Maps Online” Tutorial for what to do if you can’t find a historic map for your project.
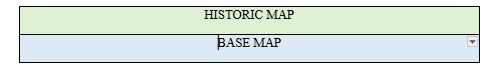
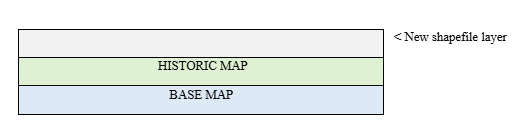
Once you’ve adjusted the transparency of your historic map, you’re ready to add your shapefiles. Follow the steps above in “Creating a Shapefile in QGIS.” Once you have that new layer created, you have a blank layer to draw geometry on, your shapes.
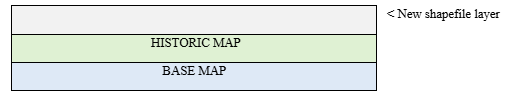
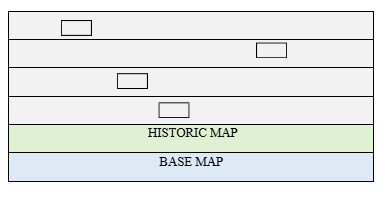
Say you want to create shapefiles for specific buildings over your historic map. You’ll most likely use polygon as your geometry type. In a single polygon shapefile, each building is a new layer, that means that only one structure exists on that shapefile layer. So vertically, it would look like this:
You would continue this pattern, creating shapefiles for all of the buildings you need on the map, and you’ll end up with something like this:
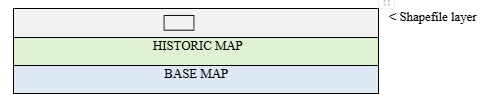
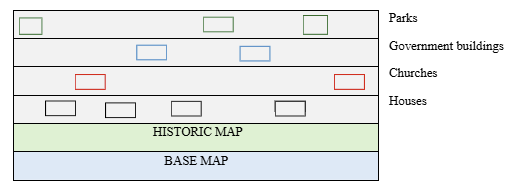
2) Multi Line/Point or Polygon Shapefile
The same few steps apply to a multipolygon shapefile:
But instead of only one structure per layer, you have multiple. If you want a single layer showing one type of building, like houses, for example, and another showing churches or communal buildings, this would be a useful option.
Whether you should use a single polygon shapefile or a multipolygon shapefile depends on what data you have, and what you want your map to represent. These are all options to think about when you upload your CSV data sheet into QGIS.
Resources: